What is your portfolio
actually costing you?
Adjust the inputs below. Your numbers appear instantly.
Est. Annual Mgmt Cost
$0
Projected Occupancy Gain
+$0
Current Revenue Leak
$0/yr
"Know what your portfolio costs you. Know what it should."
4 buildings · 0.75M SF under review · 88% occupied
Occupancy Visualization
Portfolio Schematic
A corridor of case studies.Each one larger than the last.
Private equity groups, family offices, and REITs have handed us their hardest assets. Here is what happened next.
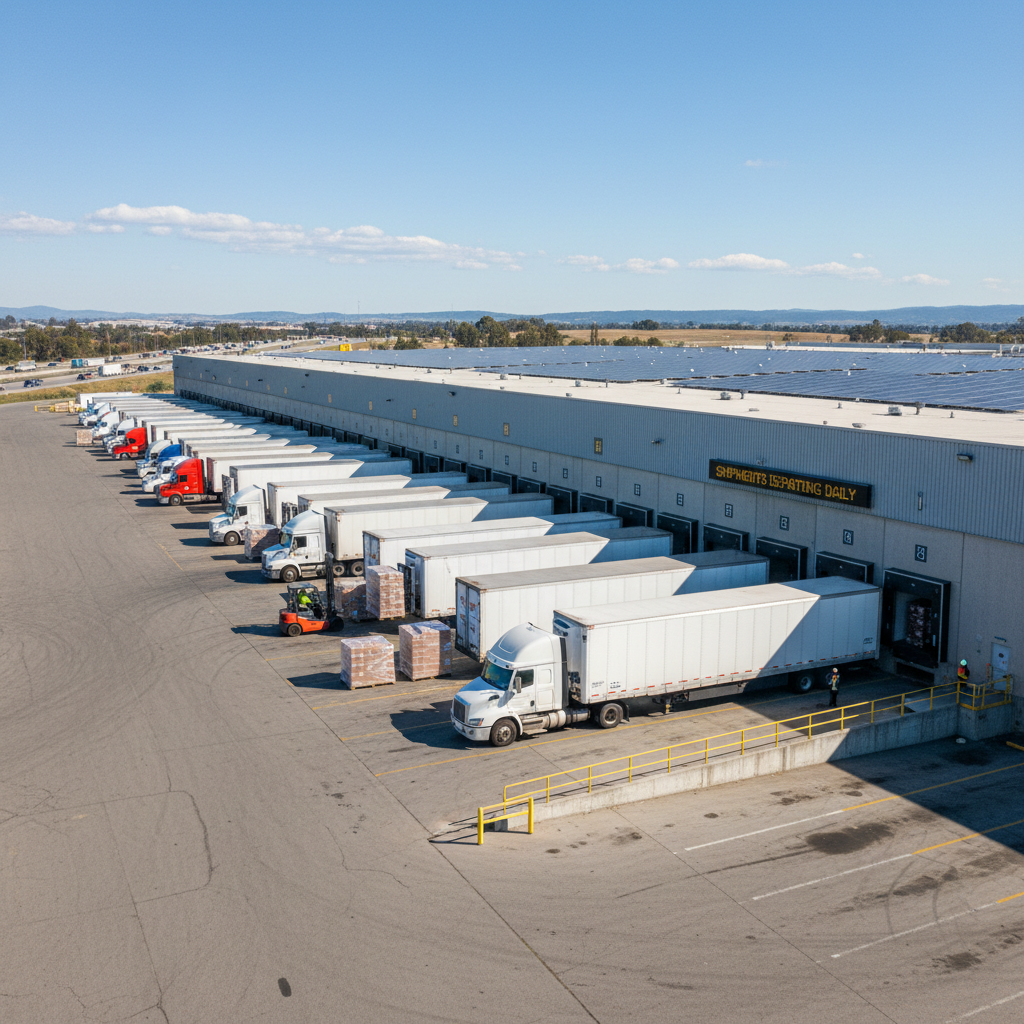
Distribution Center Campus
Inland Empire, CA
1.4M SF · 6 Buildings
Case Study 01
Tenant Retention
97.3%
Over 36-month period
Avg. Maintenance Response
2.1 hrs
Critical systems
Occupancy Gain
+6.4%
First 18 months under management
"We handed Lease a portfolio bleeding $2.1M in annual vacancy. Fourteen months later, occupancy was at 97% and our asset manager stopped getting calls."
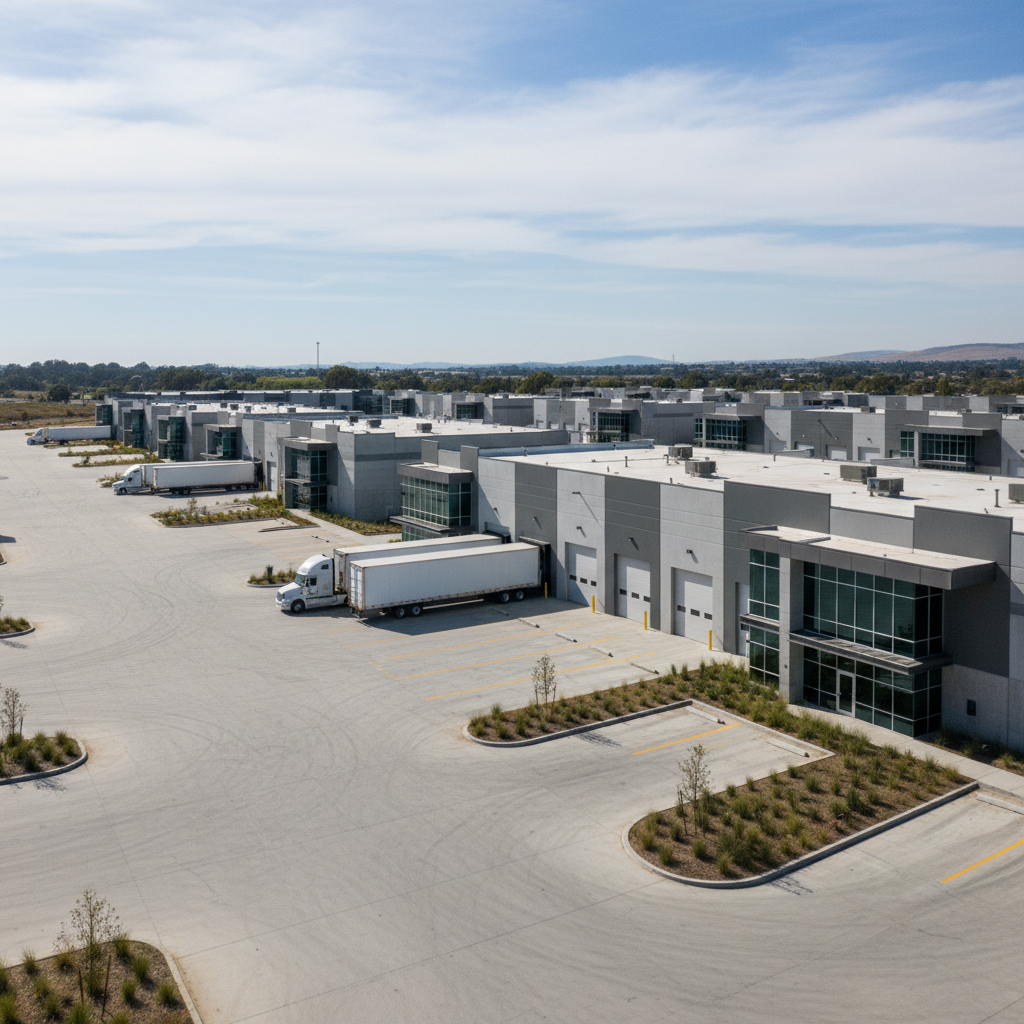
Flex Industrial Park
Dallas–Fort Worth, TX
820K SF · 14 Buildings
Case Study 02
HVAC Uptime
99.8%
Across all common systems
Lease Renewals
91%
Signed before expiry date
NOI Improvement
+18.2%
Year one vs. prior manager
"Fourteen buildings, one point of contact. They know every dock door, every tenant, every HVAC unit by serial number. That's not property management — that's operations."
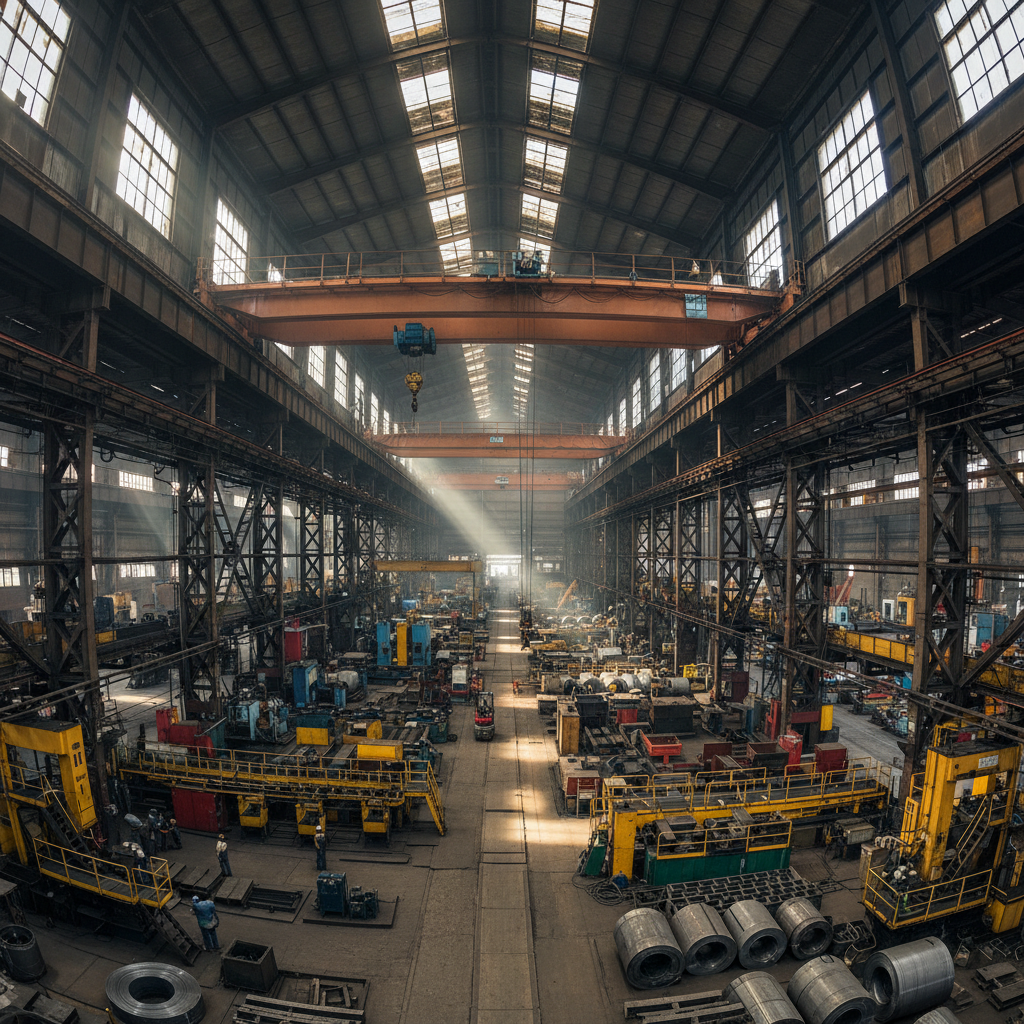
Heavy Manufacturing Facility
Chicago, IL
2.1M SF · 3 Buildings
Case Study 03
Midnight Calls to Owner
0
In 24 months of management
Capital Project Delivery
100%
On-time and on-budget
Tenant NPS Score
74
Surveyed annually
"Our REIT board asked why this asset was suddenly outperforming every benchmark. The answer was simple: we finally had a manager who treated it like a business, not a building."
0.0M
Square feet under management
Across 14 US markets
0.0%
Average portfolio occupancy
Rolling 12-month average
0.0 hrs
Mean maintenance response
Critical systems, 24/7
0
Tenants renewed early
Before lease expiry, 2025
Trusted by portfolio owners across the capital stack
The building that runs itself starts with one call.
Fluorescent bays clicking on at 6 a.m. Loading docks humming. Tenants renewing before the ink dries. That's what managed industrial looks like.
Current availability
Q2 2026 onboarding slots
A 30-minute callthat changes the math.
Bring your rent roll. We'll bring the questions your current manager hasn't asked. No pitch deck — just your numbers and ours.
Occupancy gap analysis for your specific asset class
Maintenance cost benchmarking against comparable portfolios
Tenant retention risk scoring — which leases are at risk
Not ready to talk?
Download our Management Scope Template — the exact framework we use to evaluate any industrial portfolio.
What is your portfolio size?
This determines which asset manager leads your review.
Under 500K SF
Emerging portfolio — growth-focused review
500K – 2M SF
Mid-market — operational benchmarking focus
2M+ SF
Institutional — dedicated senior manager assigned